 Anonymized report view
Data analytics & automation
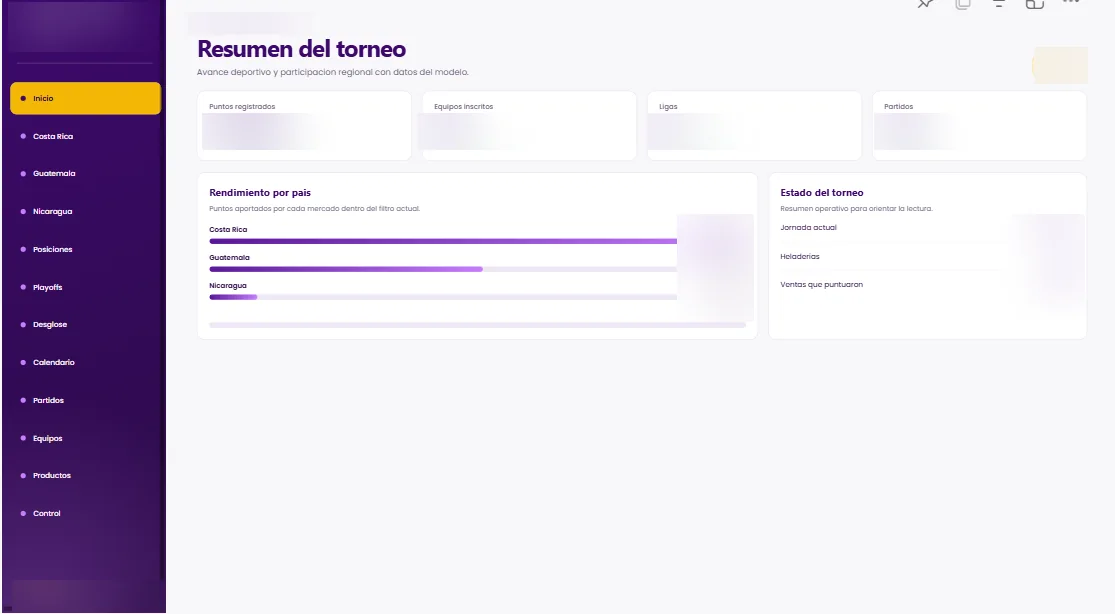
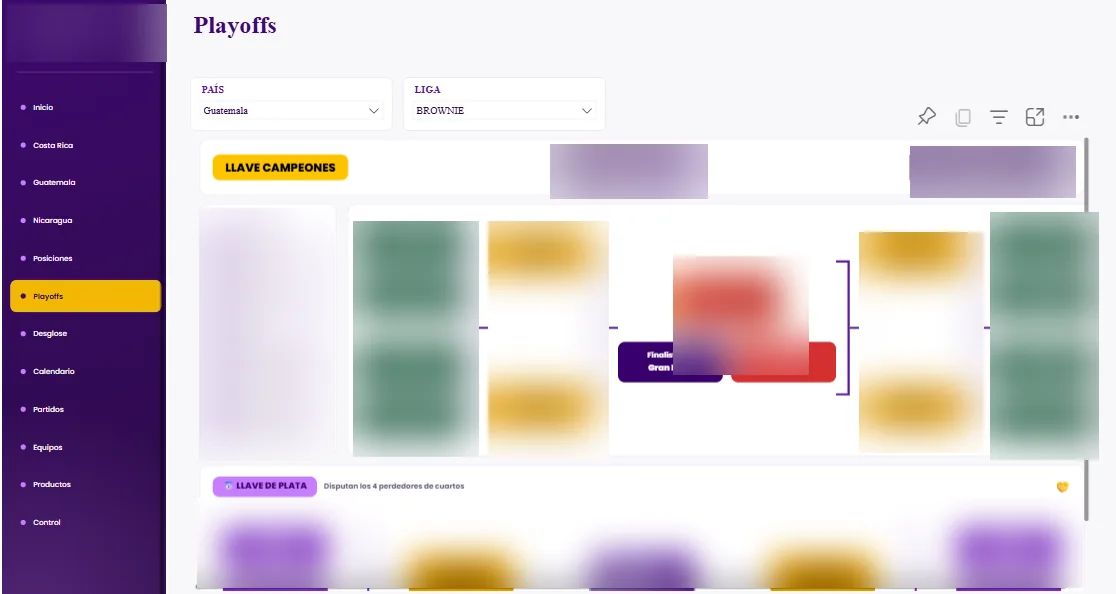
Fantasy POPS I & II
A tournament between ice cream stores in Costa Rica, Nicaragua and Guatemala, with schedules, standings and knockout rounds brought together in Power BI.
The context and my contribution
The need
Make Sistemática Comercial more engaging through regional tournaments between stores.
My contribution
Data visualizations for round-robin match calendars, points by participating items, teams, fixtures and elimination stages.
More project visuals

 Anonymized report view
Data analytics & automation
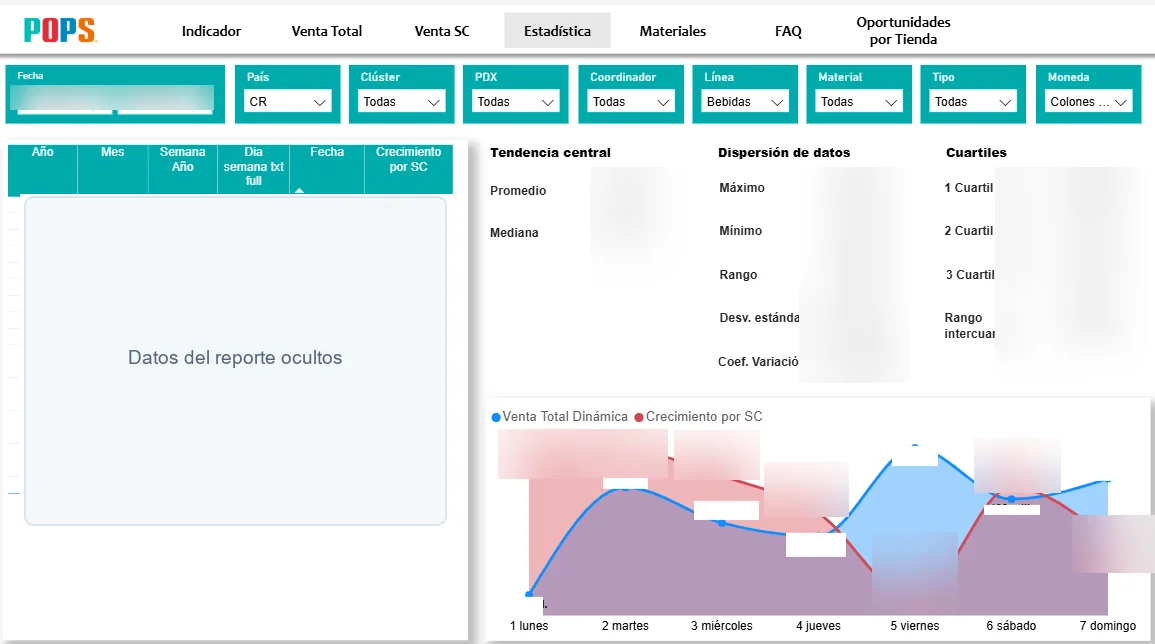
Sistemática Comercial
Invoice-level analysis of average ticket, incremental sales and suggested products, with the data cleaned and prepared for Power BI.
The context and my contribution
The need
Understand how suggesting additional products affects each invoice and the average ticket.
My contribution
I consolidate and prepare the data sources for Power BI, work on comparative and year-to-date analysis, and automate the dashboard's daily distribution to stores.
Web & automation
Quality audits module
A module for quality audits, with an automated workflow to send audit reports by email.
Web, automation & analytics
Costs
A costs workstream within the unified web platform, connecting automation with analysis.
Web & analysis
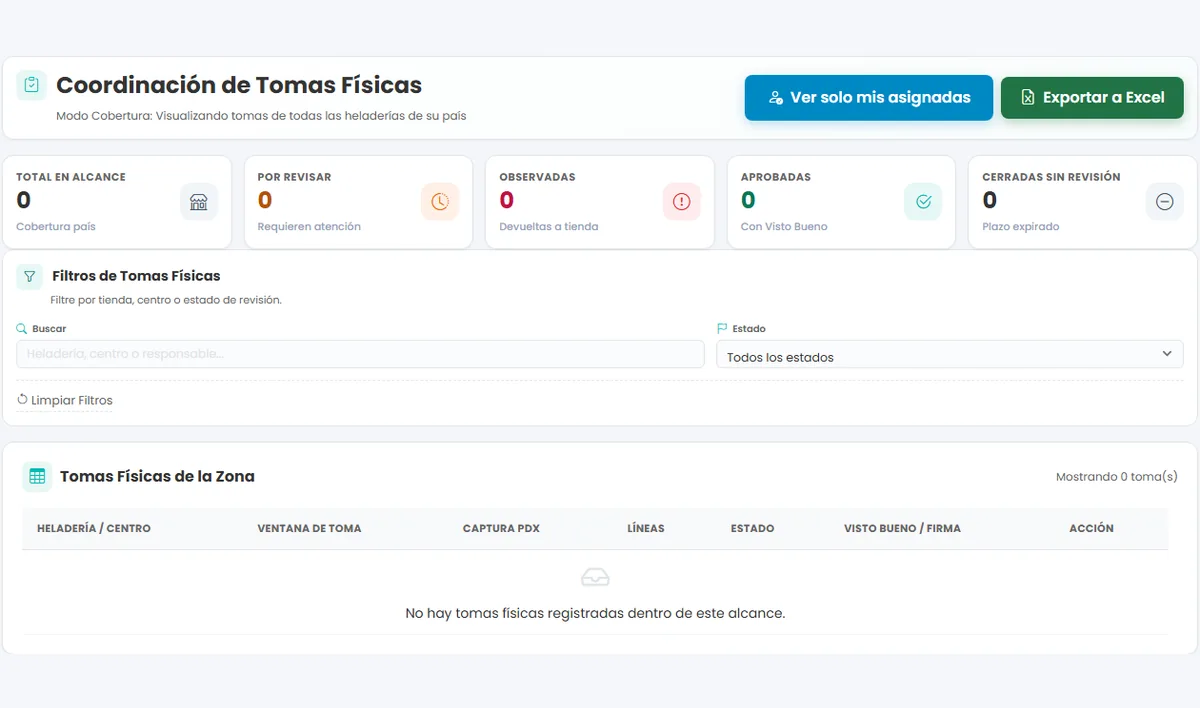
Inventory counts
Stores record physical counts so the finance team can compare them with recorded inventory and prepare adjustments.
See a test screenThe report captures have masked figures and names; the Fantasy POPS logo is blurred. The previews below show a test environment and a public page without real inventory records or customer data.